Visual Normality · SyntaGraph
One object. Every scale around it.
Follow a single vial from the component to the campus, and the evidence that keeps its context connected at every scale.
or scroll to explore
The problem
Physical operations have no shortage of data.
The problem
The problem is knowing which of it is true, current and connected to the rest.
01 Component
Start with one object.
One vial, drawn at real scale. The drawing, the specification, the scan and the field observation each describe it a little differently.
01 Component
Every fact should know where it came from.
SyntaGraph reconciles drawings, documents, scans and field observation into grounded context for the object. When the sources agree, the object is confirmed.
02 Asset
Context gives the object meaning.
The vial enters a decontamination module. Geometry alone is not context.
02 Asset
One object becomes part of an asset.
SyntaGraph connects what something is, where it is, what it depends on and the evidence behind each of those facts.
03 Line
Context becomes a system.
Decontamination, inspection, cartoning and serialisation. Machines do not operate in isolation.
03 Line
The line is a network of physical and engineering dependencies.
SyntaGraph makes those relationships queryable.
03 Line
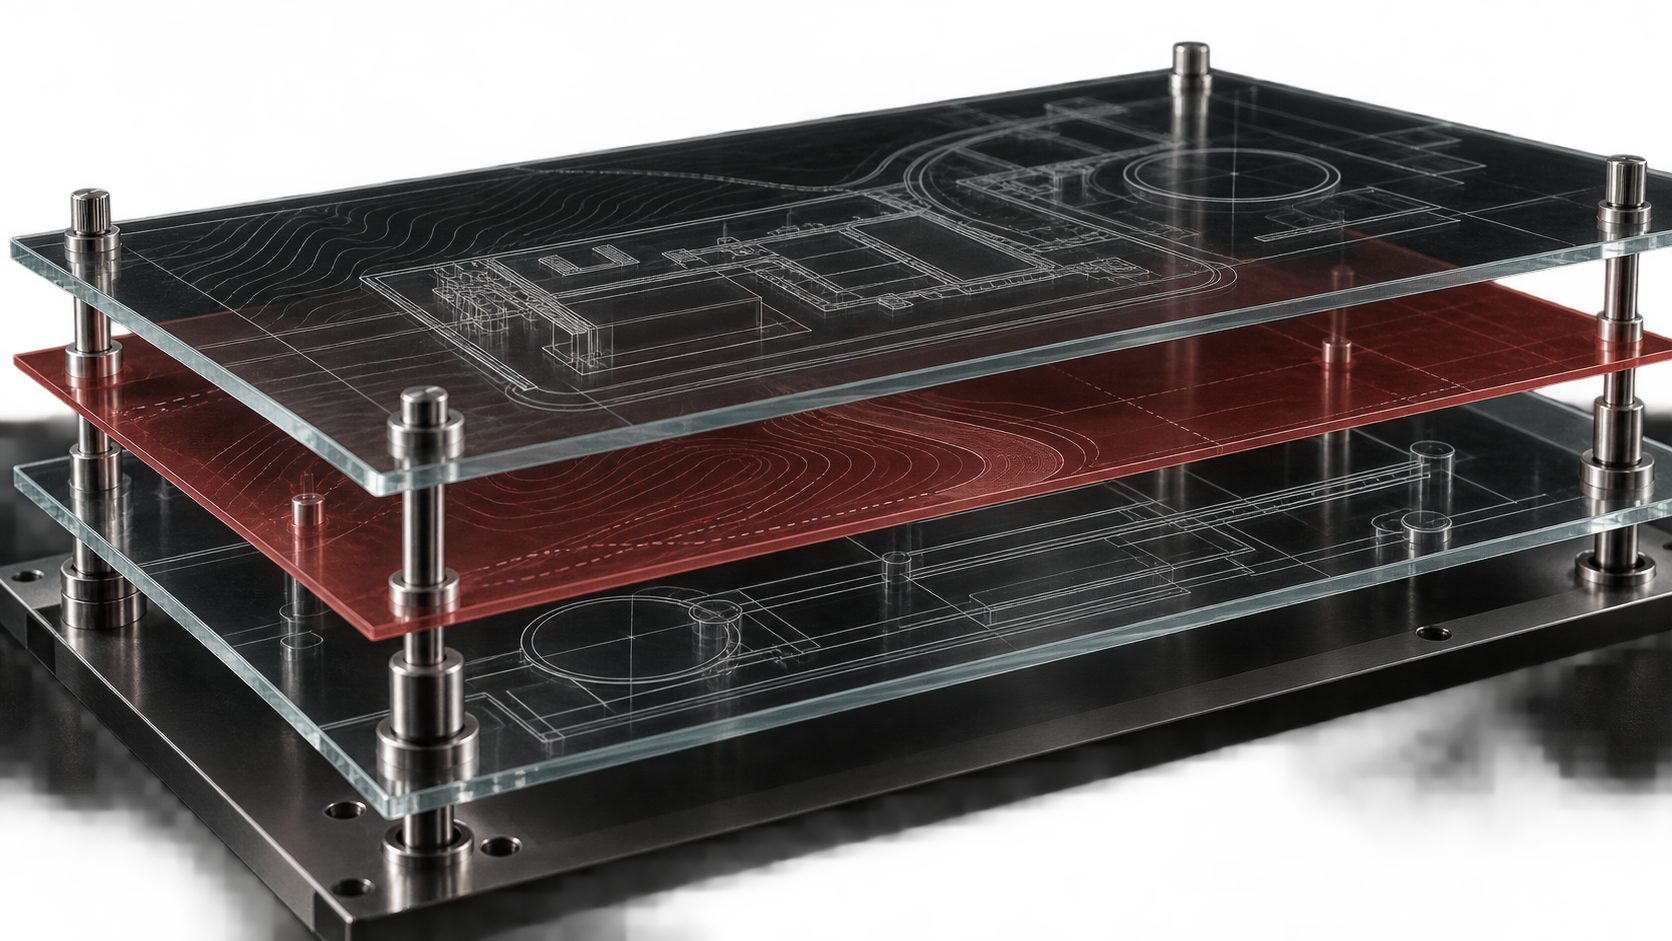
The graph is the context. The 3D world is one view of it.
The evidence layer can feed the visualisation environment a site already uses.
04 Area
Decisions happen in space.
The line stands in a bay with its air supply, its extract, its service zone and its material route.
04 Area
Design intent is not always physical reality.
A scan over the design finds one duct where it was built, and the model is corrected to what was found.
04 Area
If this containment enclosure changes, what else is affected?
Change one thing and the consequences rarely stop there. SyntaGraph gives engineering teams the context to understand those consequences.
05 Building
Changes propagate.
A line is part of a building, and a building is another connected system.
05 Building
Engineering decisions cross room boundaries and disciplines.
Each layer of evidence is kept apart and can be shown on its own.
06 Campus
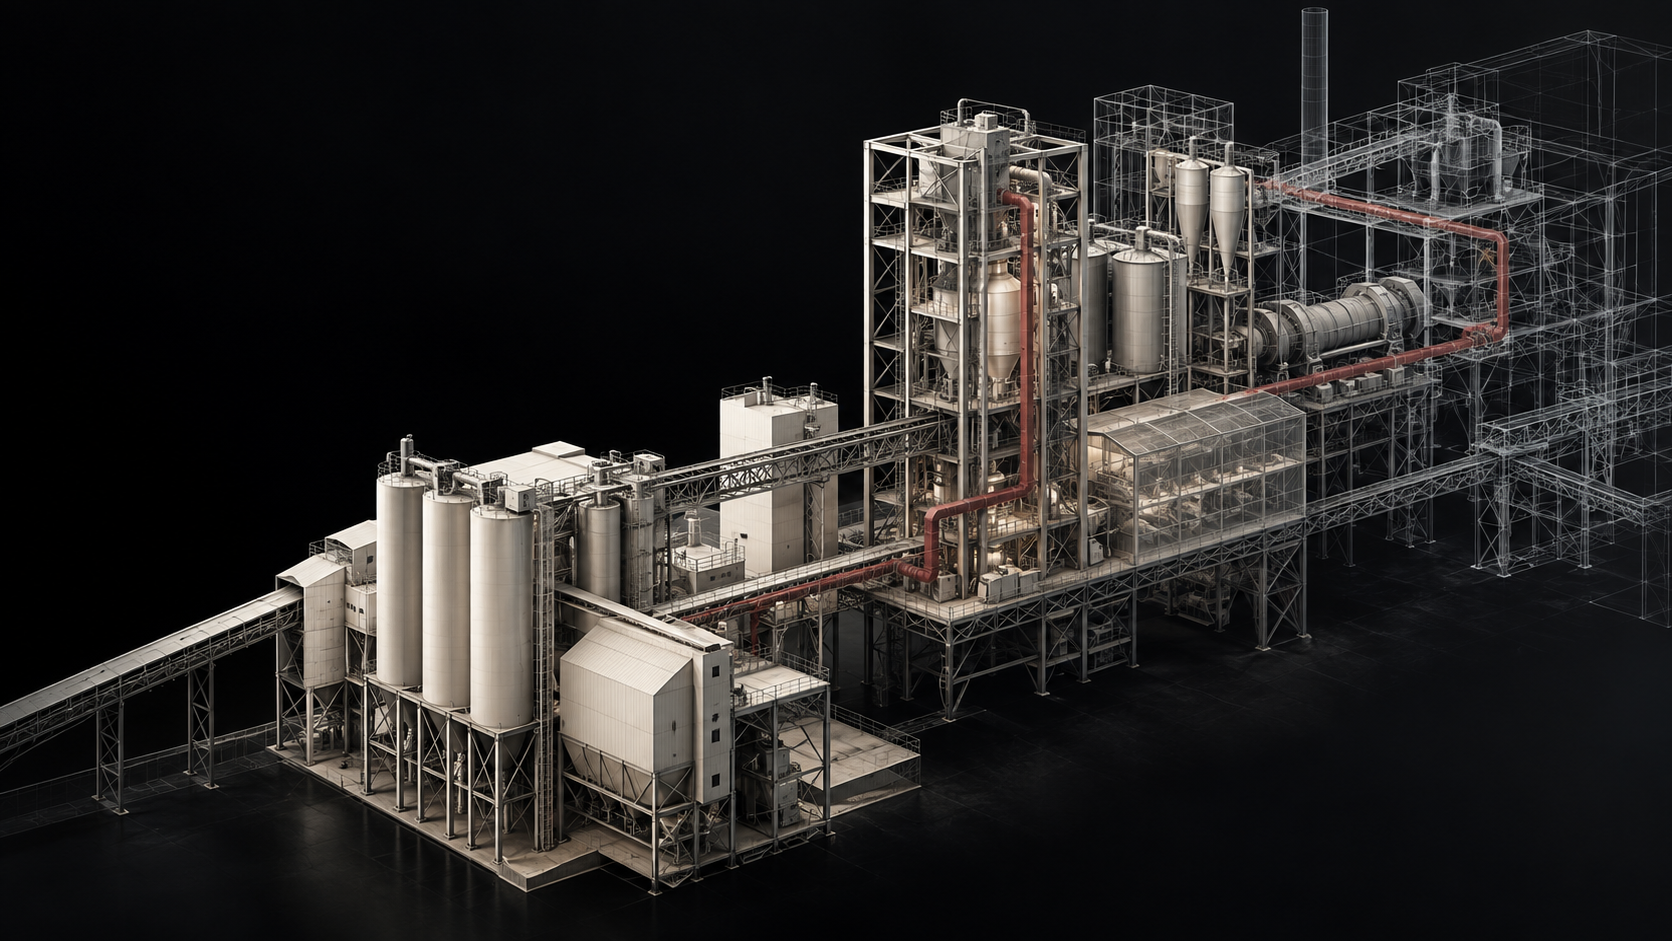
From one object to the physical enterprise.
The bay stays locatable, the line stays connected and the vial keeps its lineage.
06 Campus
Take the world away and the context remains.
SyntaGraph is the context underneath the visualisation. The 3D scene is one way to look at it.
Visual Normality · SyntaGraph
From component to campus, one evidence-backed context layer.
Visual Normality gives engineers a trustworthy model of physical reality, so they can understand it and change it, and so intelligence can later be built on it. In time, the same grounded context can become the substrate for engineering agents and increasingly autonomous physical systems.
Bring us the question. We build the evidence required to answer it.
We do the engineering work a plant buys across its life, starting at the front end.
Feasibility, pre-tender baselines, handover verification, change-control assessments, turnaround readiness and due diligence. Each study starts from a model of the site that our engineers build from the drawings, scans, photographs and records the site already holds, reconciled against what they find on the walk.
Where the drawing and the plant disagree, the study says so before the tender goes out. Design on the verified plant is the next rung. Today the deliverables are studies, registers and verdicts, and the site's engineer of record signs them.
Where the first purchase comes from
Two doors, depending on what the site has in front of it.
A new line or building in its front end
The first purchase is SyntaGraph attached to the project: the evidenced site model, the factory model and the discrepancy register the EPCM bids against. The project manager buys it from the project's existing-conditions budget, the line that already pays for surveys and site data. Once we are an onboarded vendor on the project, the engineering studies follow as change orders.
A customer can start with the model alone. We prefer a study alongside it, because the verdict is what closes the record, but we do not make it a condition.
SyntaGraph on a capex projectNo big project, one awkward question
Can this equipment fit here? Where there is no big project, a verdict on one placement, at a fixed scope and a fixed price, is how the work starts. Our engineer walks the bay, checks footprint, clearance, access and utilities against what is installed, and returns the answer together with the discrepancies found on the way.
When the question is bigger than one bay, it becomes a feasibility study on the same site model.
The fit questionThree fronts on one site model.
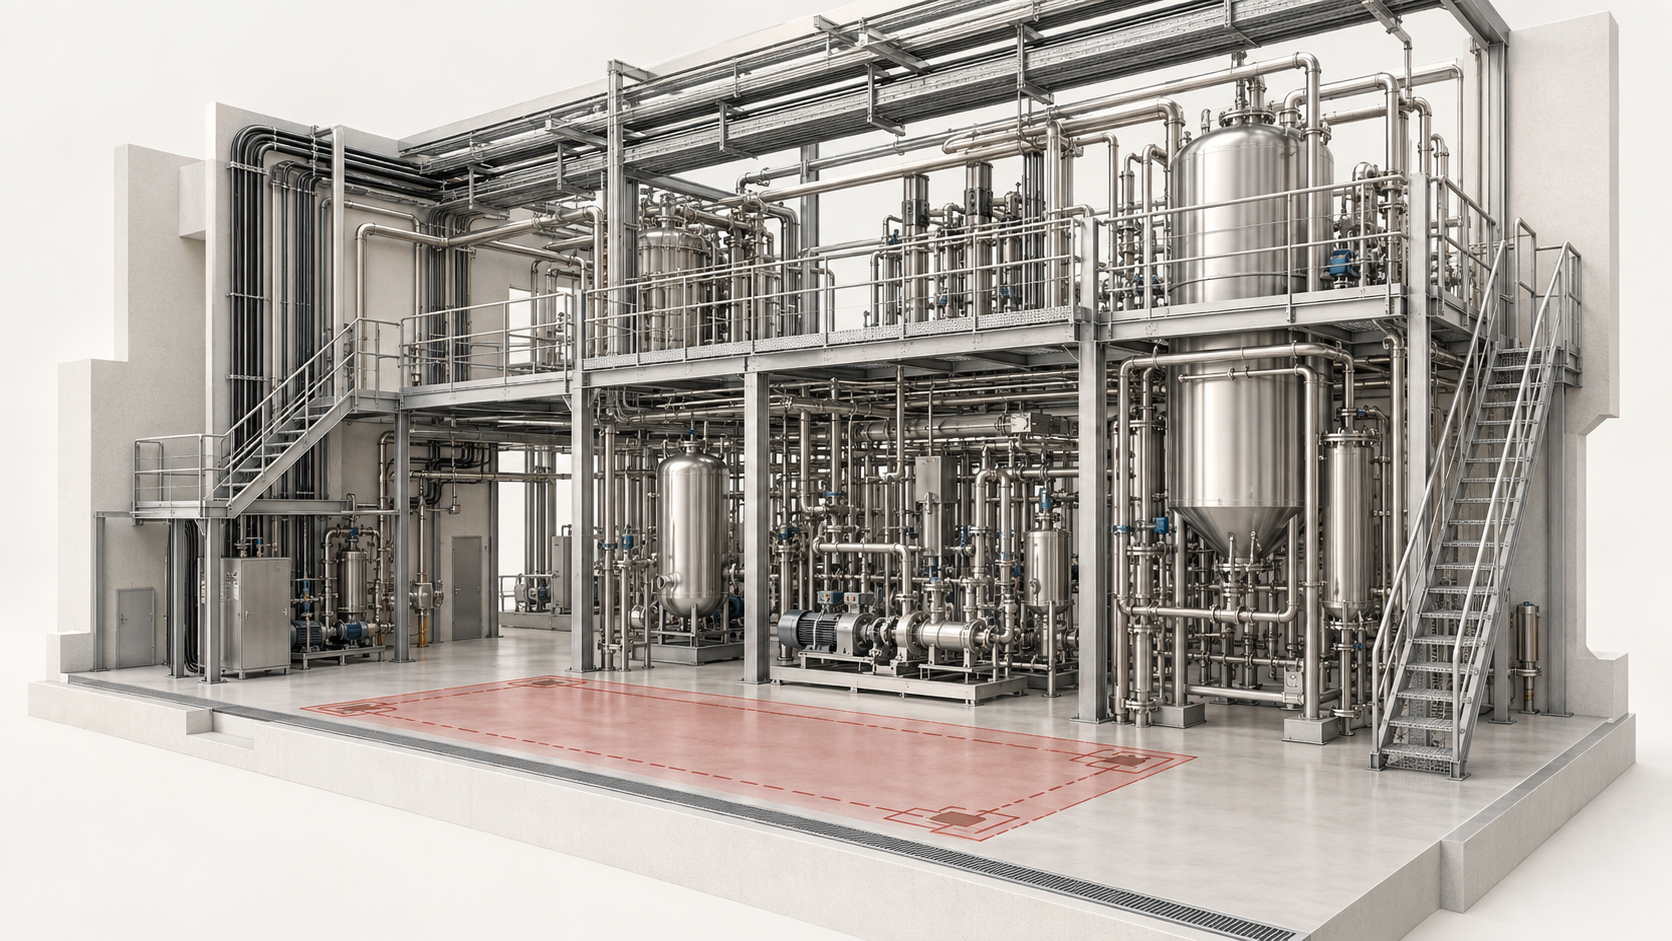
VN Engineering
Front end, pre-tender, handover, change control, turnaround and due diligence. The studies a project engineer commissions, delivered on the plant as built.
Engineering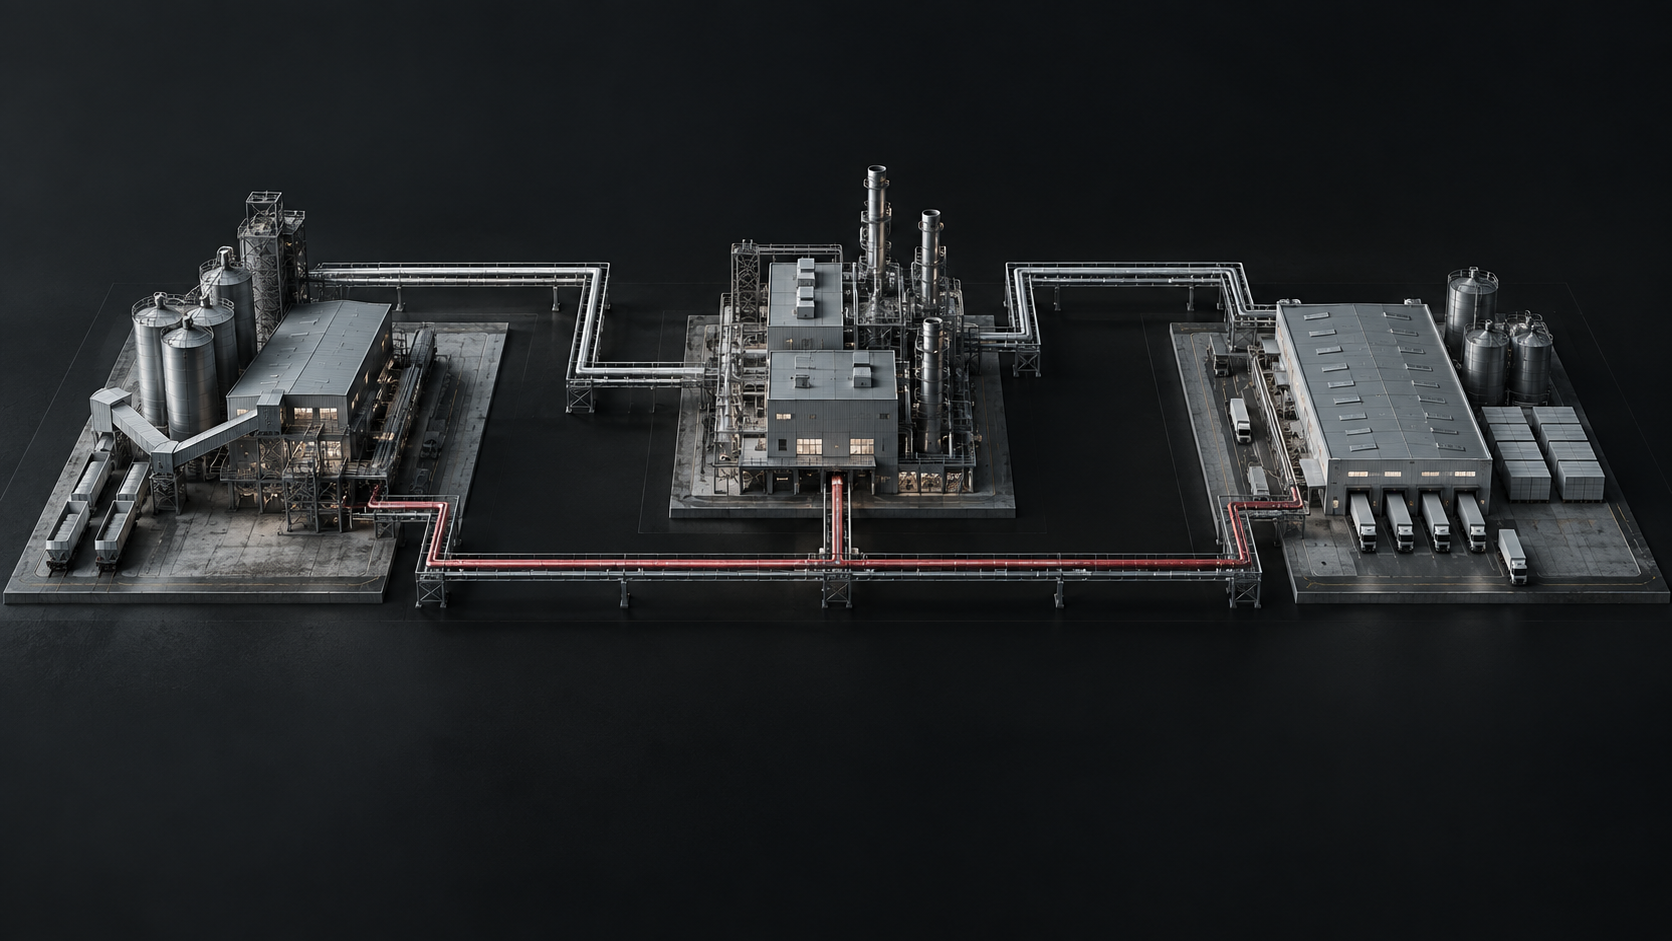
VN Supply Chain
Capacity, downtime and transfer questions answered on the same site model, from the planner's own exports, validated fact by fact.
Supply Chain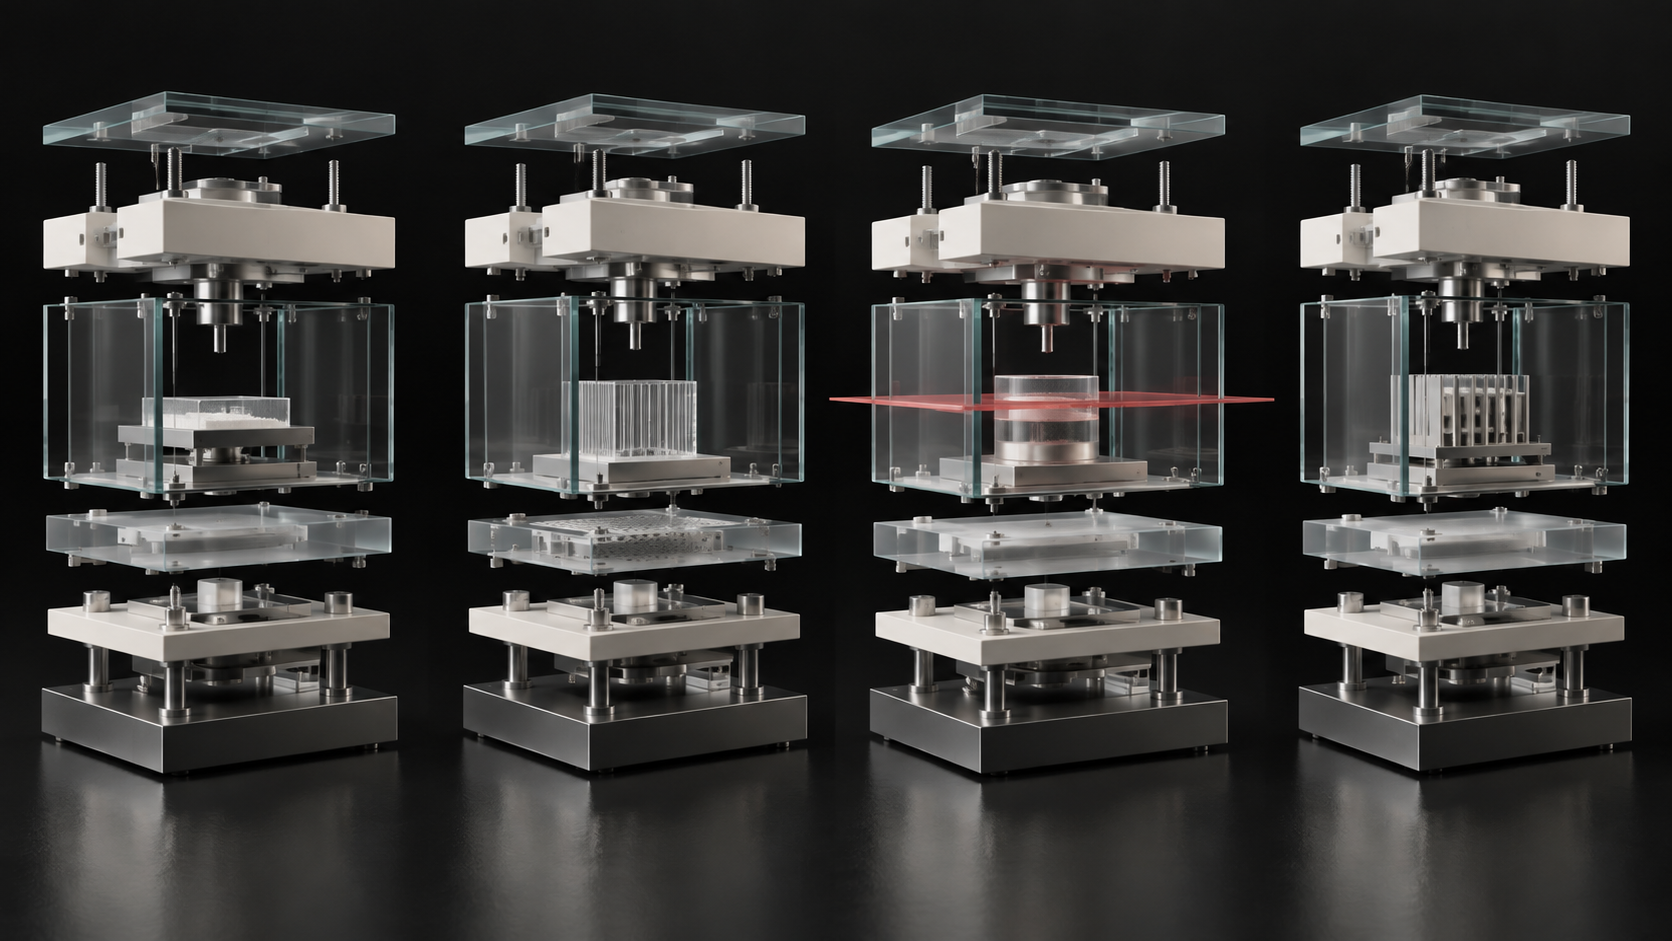
VN Applied Labs
Environments, evaluations and verifiers for AI builders, built from synthetic plants. Customer sites stay the private exam.
Applied LabsThe plant you can ask what happens if.
Every study starts from the site as evidenced. The same site can be asked what a change does to the air, the heat and the utilities around it: whether the new line creates a hotspot in the bay, whether the extract holds the pressure cascade, whether the utility headroom is really there.
Each boundary condition points to its evidence, and each result is labelled screened, verified, measured or signed. What your product does inside the machine stays with your process engineer, and the study says so.
This capability is being built into SyntaGraph. Until it exists, a proposal states which questions are answered by declared hand calculation and which are Not Demonstrated.
One bay, drawn by code to show the method. The session is scripted and shows no real result.
The record outlives the project.
A verdict keeps its evidence, its conditions and the approval that followed. The discrepancy register from a handover check is the one the site would otherwise carry for years. Every later question on that site starts from the record, which is why the second study costs less than the first.
- ObservedPhysical state
- AttachedEvidence
- FoundConstraints
- SignedThe engineer's decision
- DoneAction
- MeasuredOutcome
When the evidence cannot carry a conclusion, the verdict says Not Demonstrated and names the evidence that would close it. We price and deliver that answer like any other.
Tell us about the project.
Written for project engineers and project managers with a line, a building or a placement in front of them, for supply chain and site leads with a capacity question, and for AI teams that need a harder physical test.